credit: Steno Museum
Foucault's Pendulum and the Coriolis Force
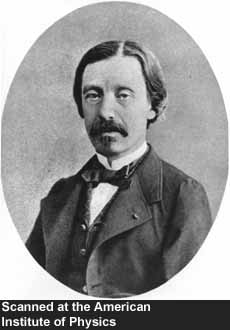
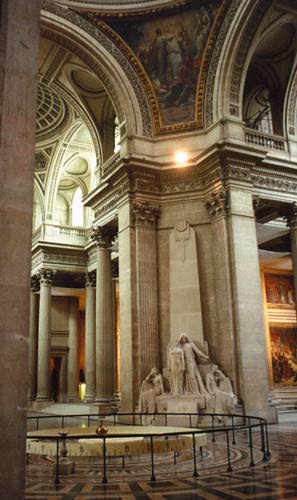
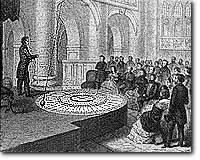
In 1851, the French physicist Jean Léon Foucault hung a 67-meter pendulum from the dome of the Panthéon to demonstrate the rotation of the earth for the first time.
 |
 |

credit: Steno Museum |
The wire was attached to the ceiling through a universal joint so it could rotate freely about its axis. As the pendulum oscillated, the ground underneath it would rotate slowly, so the trajectory of the weight changed its course as the day progressed.
| We can reenact Foucault's experiment conveniently in the laboratory. In this experiment, the pendulum is hung above a turntable. There is a camera mounted on the ceiling looking down on the pendulum and the table. (The pendulum is hung on a plexy glass so the camera sees through it.) The camera rotates with the turntable at the same rate, so the video image appears as though it was filmed by an observer standing on the turntable (like a man on the rotating planet). The live image from the camera is projected on the plasma screen on the wall. To an observer in the laboratory, the pendulum swings linearly whether the turntable is rotating or not. However, as soon as the turntable starts to rotate, the trajectory of the weight in the plasma screen begins to draw a curved loop. |
There are three parameters in this experiment:
 |
and two intrinsic time scales:
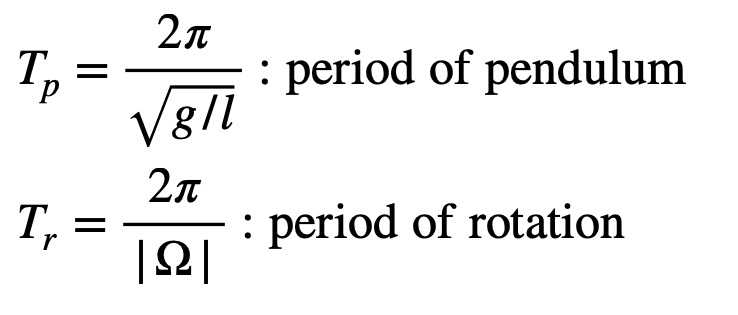 |
The nature of the result depends on the ratio of these time scales, or the Rossby number:
 |
A large Rossby number means that the rotaion is slow compared to the pendulum's oscillation, so its effect is small. A small Rossby number, on the other hand, means that the pendulum's motion is significantly affected by rotation.
 |
|
|
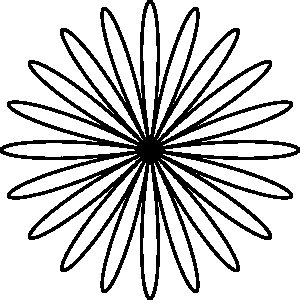
When Ro >> 1 but finite, the trajectory in the rotating frame of reference traces out many lobes. This might look drastically different from the linear trajectory of the nonrotating case (Ro = infinity), but the trajectory at any given time is close to linear and it takes a long time to complete a circuit. The right diagram is the theoretical prediction of the trajectory. |
Ro = 10
|
 |
|
|
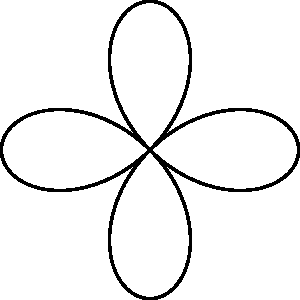
When Ro decreases, the trajectory becomes more curved with a reduced number of lobes. In fact, when Ro is an integer, the number of the lobes per rotation period is 2Ro. |
Ro = 2
|
|
|
|
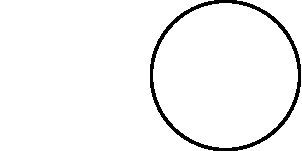
When Ro = 1, the trajectory becomes a circle. Wait, according to the above formula, shoudn't there be two circles? Well, the two circles overlap each other and the weight goes around the circle twice per rotation period. This is called an inertial circle. |
Ro = 1
|
 |
The left diagram shows the horizontal forces acting on the weight. The origin (O) is the equilibrium point of the pendulum and also the axis of rotation. The gravity pulls the weight towards the origin. In addition, when viewed from within the rotating turntable, the centrifugal force pulls the weight away from the origin. The line of action coincides for these forces.
Furthermore, the Coriolis force acts in the direction perpendicular to the velocity of the weight. When the rotation of the turntable is counterclockwise, the Coriolis force acts to deflect the motion of the weight to the right. Since the line of action of the Coriolis force is different from that of the other forces, the oscillation of the pendulum is no longer linear (1D) but traces out a loop (2D).
For simplicity, we will ignore damping (resistance of air, etc).
When these forces are incorporated to Newton's 2nd law, the equations of motion for the weight become (derive this for your exercise!)
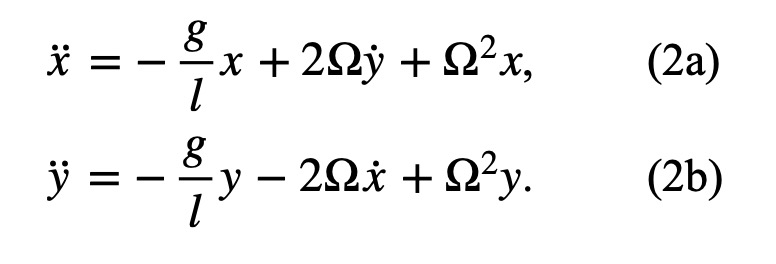 |
The left hand sides of the above equations are the rate of acceleration in x and y directions, whereas the three terms on the right hand side represent gravitational, Coriolis, and centrifugal accelerations. Notice that these equations are coupled: y appears in the x-equation, etc.
The above equations can be combined into a single equation by introducing a complex variable z
 |
where i is the imaginary unit. The last equation can be easily solved:
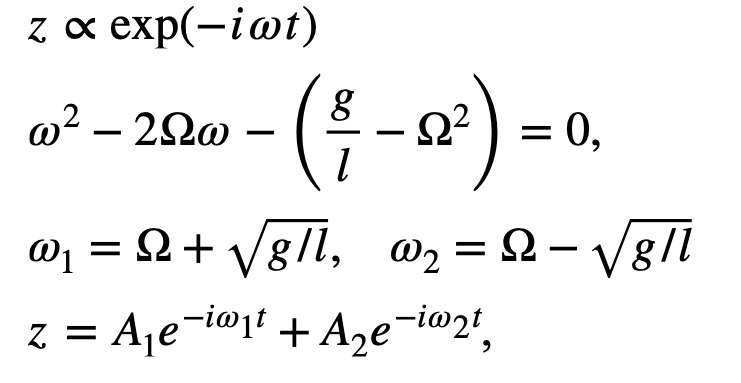 |
where the two coefficients are determined from the initial conditions. The theoretical trajectories in the above figures were calculated using this formula.
Notice in Eqns. (2a) and (2b) that when Ro = 1, the gravitational and centrifugal accelerations cancel, so the net acceleration is solely due to the Coriolis force. In this case the weight traces out the inertial circle (why?).
Mathematically, Eqns. (2a) and (2b) admit a special solution when g = 0, at which point the two eigenvalues coalesce at Ω. In this case, the solution becomes
 |
Since the zero gravity is difficult to achieve in the lab, we will demonstrate this using computer graphics. The next animation shows the motion of an object traveling on a rotating disk. The left is the view from outside the disk (i.e., the inertial frame), which shows the object moving in a straight line on a rotating disk. The right shows the same phenomenon but from within the rotating disk. The object is deflected to the right, and the trajectory curves out a spiral given by the above expression (in this case V1 = 0 and V2 is the linear velocity of the object). Note that both the Coriolis force and centrifugal force are acting on the object.
When the speed of the object is doubled (the left panel in the next animation; compare this with the standard case on the right), the amount of deflection becomes less. This might sound paradoxical given that the Coriolis force is proportional to the velocity of the object. However, since it takes half the time for the object to reach the edge, there is less time available for the Coriolis force to deflect the object. It turns out that the amount of deflection is approximately proportional to the square of the travel time times the velocity, so the reduced time has a greater influence than the enhanced velocity.
Since there is no gravity in this example, we cannot use (1) to define the Rossby number. But we can define it as the ratio of the period of rotation to the traveling time Tt
 |
where R is the radius of the disk. As Ro decreases, the amount of deflection (relative to the size of the disk) increases.
The concept of Rossby number is important in geophysical fluid dynamics. It is a measure of the flow time scale relative to the rotation time scale of the planet. The picture below shows Jupiter's circulation observed by NASA's Voyager spacecraft as it approached the gas planet. The movie consists of 60 frames, each taken once every Jovian day. Since the frames are precicely one Jovian day apart, the planet appears not rotating, but it actually rotates once between the frames. The very fact that the movie appears smooth tells us that the Jovian circulation is slow compared to the planet's rotation, namely Ro << 1. Therefore the circulation is strongly influenced by the rotation. The flow behavior under this condition is significantly different from that of a nonrotating fluid (to be discussed later). Notice the alternating prograde and retrograde zonal flow bands and turbulent-looking flow around the Great Red Spot. The large-scale circulations of the earth's atmosphere and ocean are also in the small Rossby number regime.